What is AWS CloudWatch and it's Inner Workings ☁️⌚
Hey 👋 My name is Debasish, I'm a System Engineer and a passionate Web Developer who loves to experiment with new technologies and build projects. I like to share and showcase my tips and knowledge on this blog. Since you are here feel free to browse through some of my posts, I'm sure you will find something useful and interesting. Hope you are feeling excited!
What is AWS CloudWatch 🤔:
AWS CloudWatch is a monitoring service of Amazon Web Service (AWS) that collects monitoring and operational data in the form of logs, metrics and events. It can present the data by using automated dashboards so you can get a view of your AWS resources and applications.
CloudWatch can help you:
Monitor and fix operational issues
Measure and optimize performance through logging
Monitor AWS applications on-premises or in the cloud
Automatically react to changes in your Amazon Web Services resources
CloudWatch alarms use the Simple Notification Service (SNS) to inform you of alarm changes. SNS is a notification service that can inform you in case of any errors. It allows you to send personalized emails, SMS, or In-App Notifications in case of alarms.
So no matter what kind of application you're working with or what region it belongs to, you get the facility to create log streams and send application and resource logs to Cloudwatch so that you can analyze the metrics and logs and you can act quickly to resolve the issues. Business-critical applications need a data set and real-time analysis to ensure that the application has very little downtime and as a solutions architect it's your job to ensure that you have this in place. You can't ignore few resources or services just because you don't like them or if you're working on a multi-tier application you cannot ignore the database because you are just storing data there that's not going to work. With Cloudwatch you get the exposure to monitor and get data about all the tiers of the application that you have so that you won't miss out on anything.
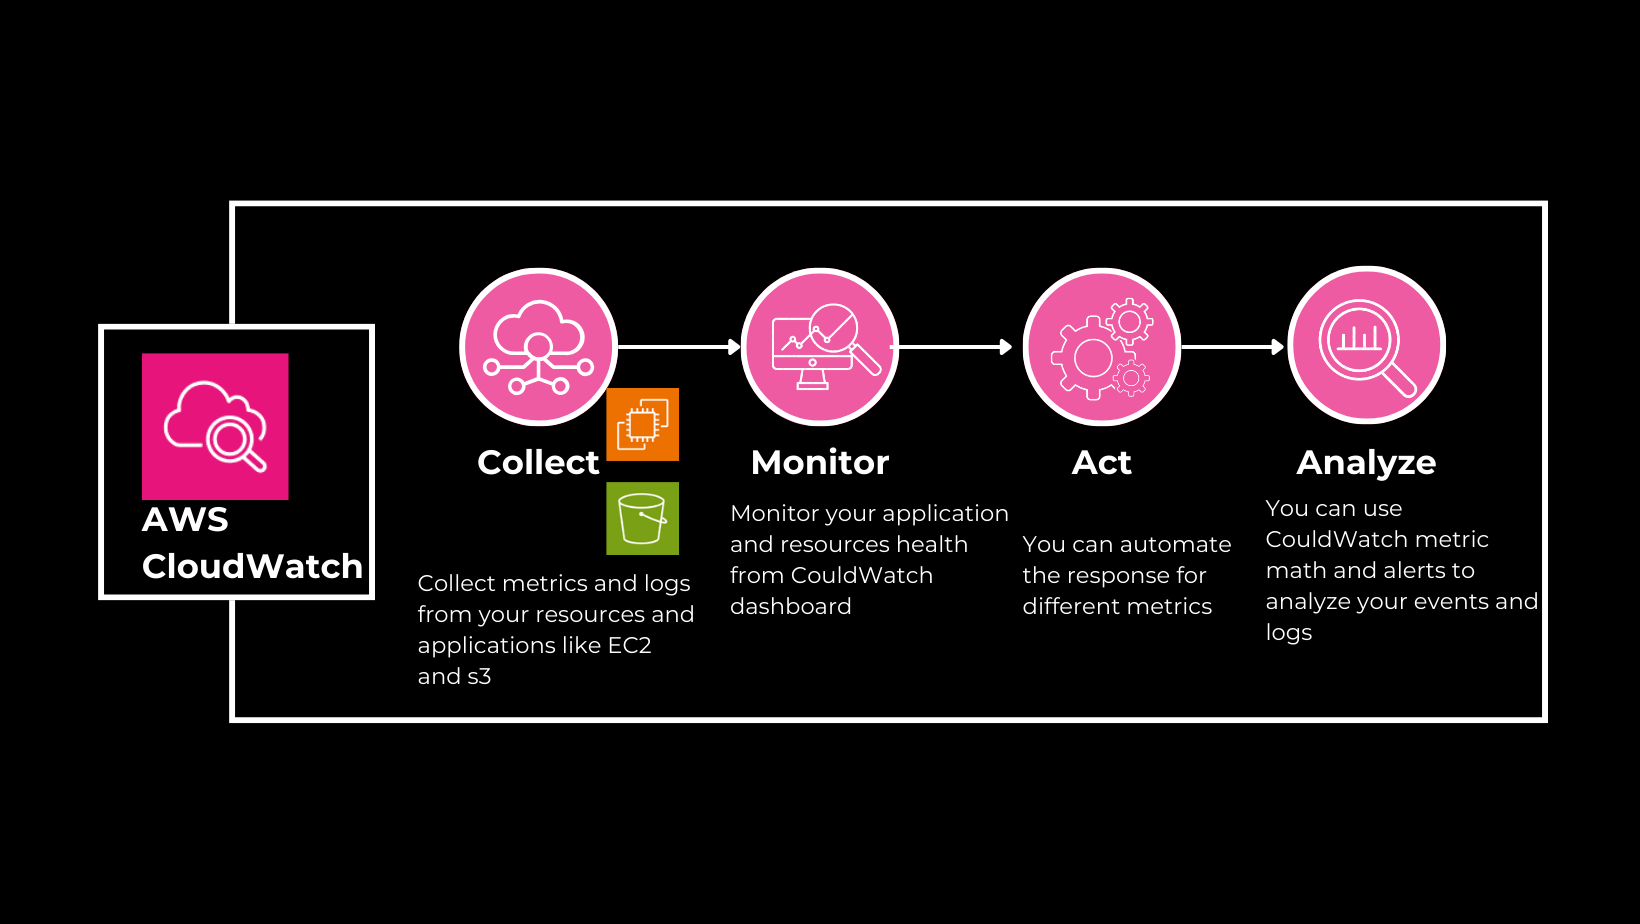
How CloudWatch works❓

CloudWatch is nothing but a metrics repository concerning every AWS service which the user is associated with. Users are also able to create customized dashboards that help display metrics about specific applications. They can also be used to display a customized collection of metrics that are chosen by the user.
Alerts can be created by the user that help in monitoring the metrics and sending notifications regarding the state of the metrics. These alerts can also be used to automatically make certain changes to the AWS resources which are being monitored by the user when a certain condition is met or a threshold is reached.
For example:
If the CPU utilization of the instance goes above 80% then I want to scale up to a new resource, then my benchmark is CPU utilization and the threshold value is 80% here. If the CPU utilization goes above 80% then a new resource is created. We can create an alarm for the same, we can put the threshold value of 80% for the metrics CPU utilization and we can get the alarm for that.
We can use SNS service to coordinate and manage the delivery of sending messages to subscribing endpoints or clients. This service can be integrated with CloudWatch to send messages to the user when an alarm threshold is reached or a condition is met.
CloudWatch can also be integrated with Amazon EC2 to scale the EC2 instance based on the requirements.
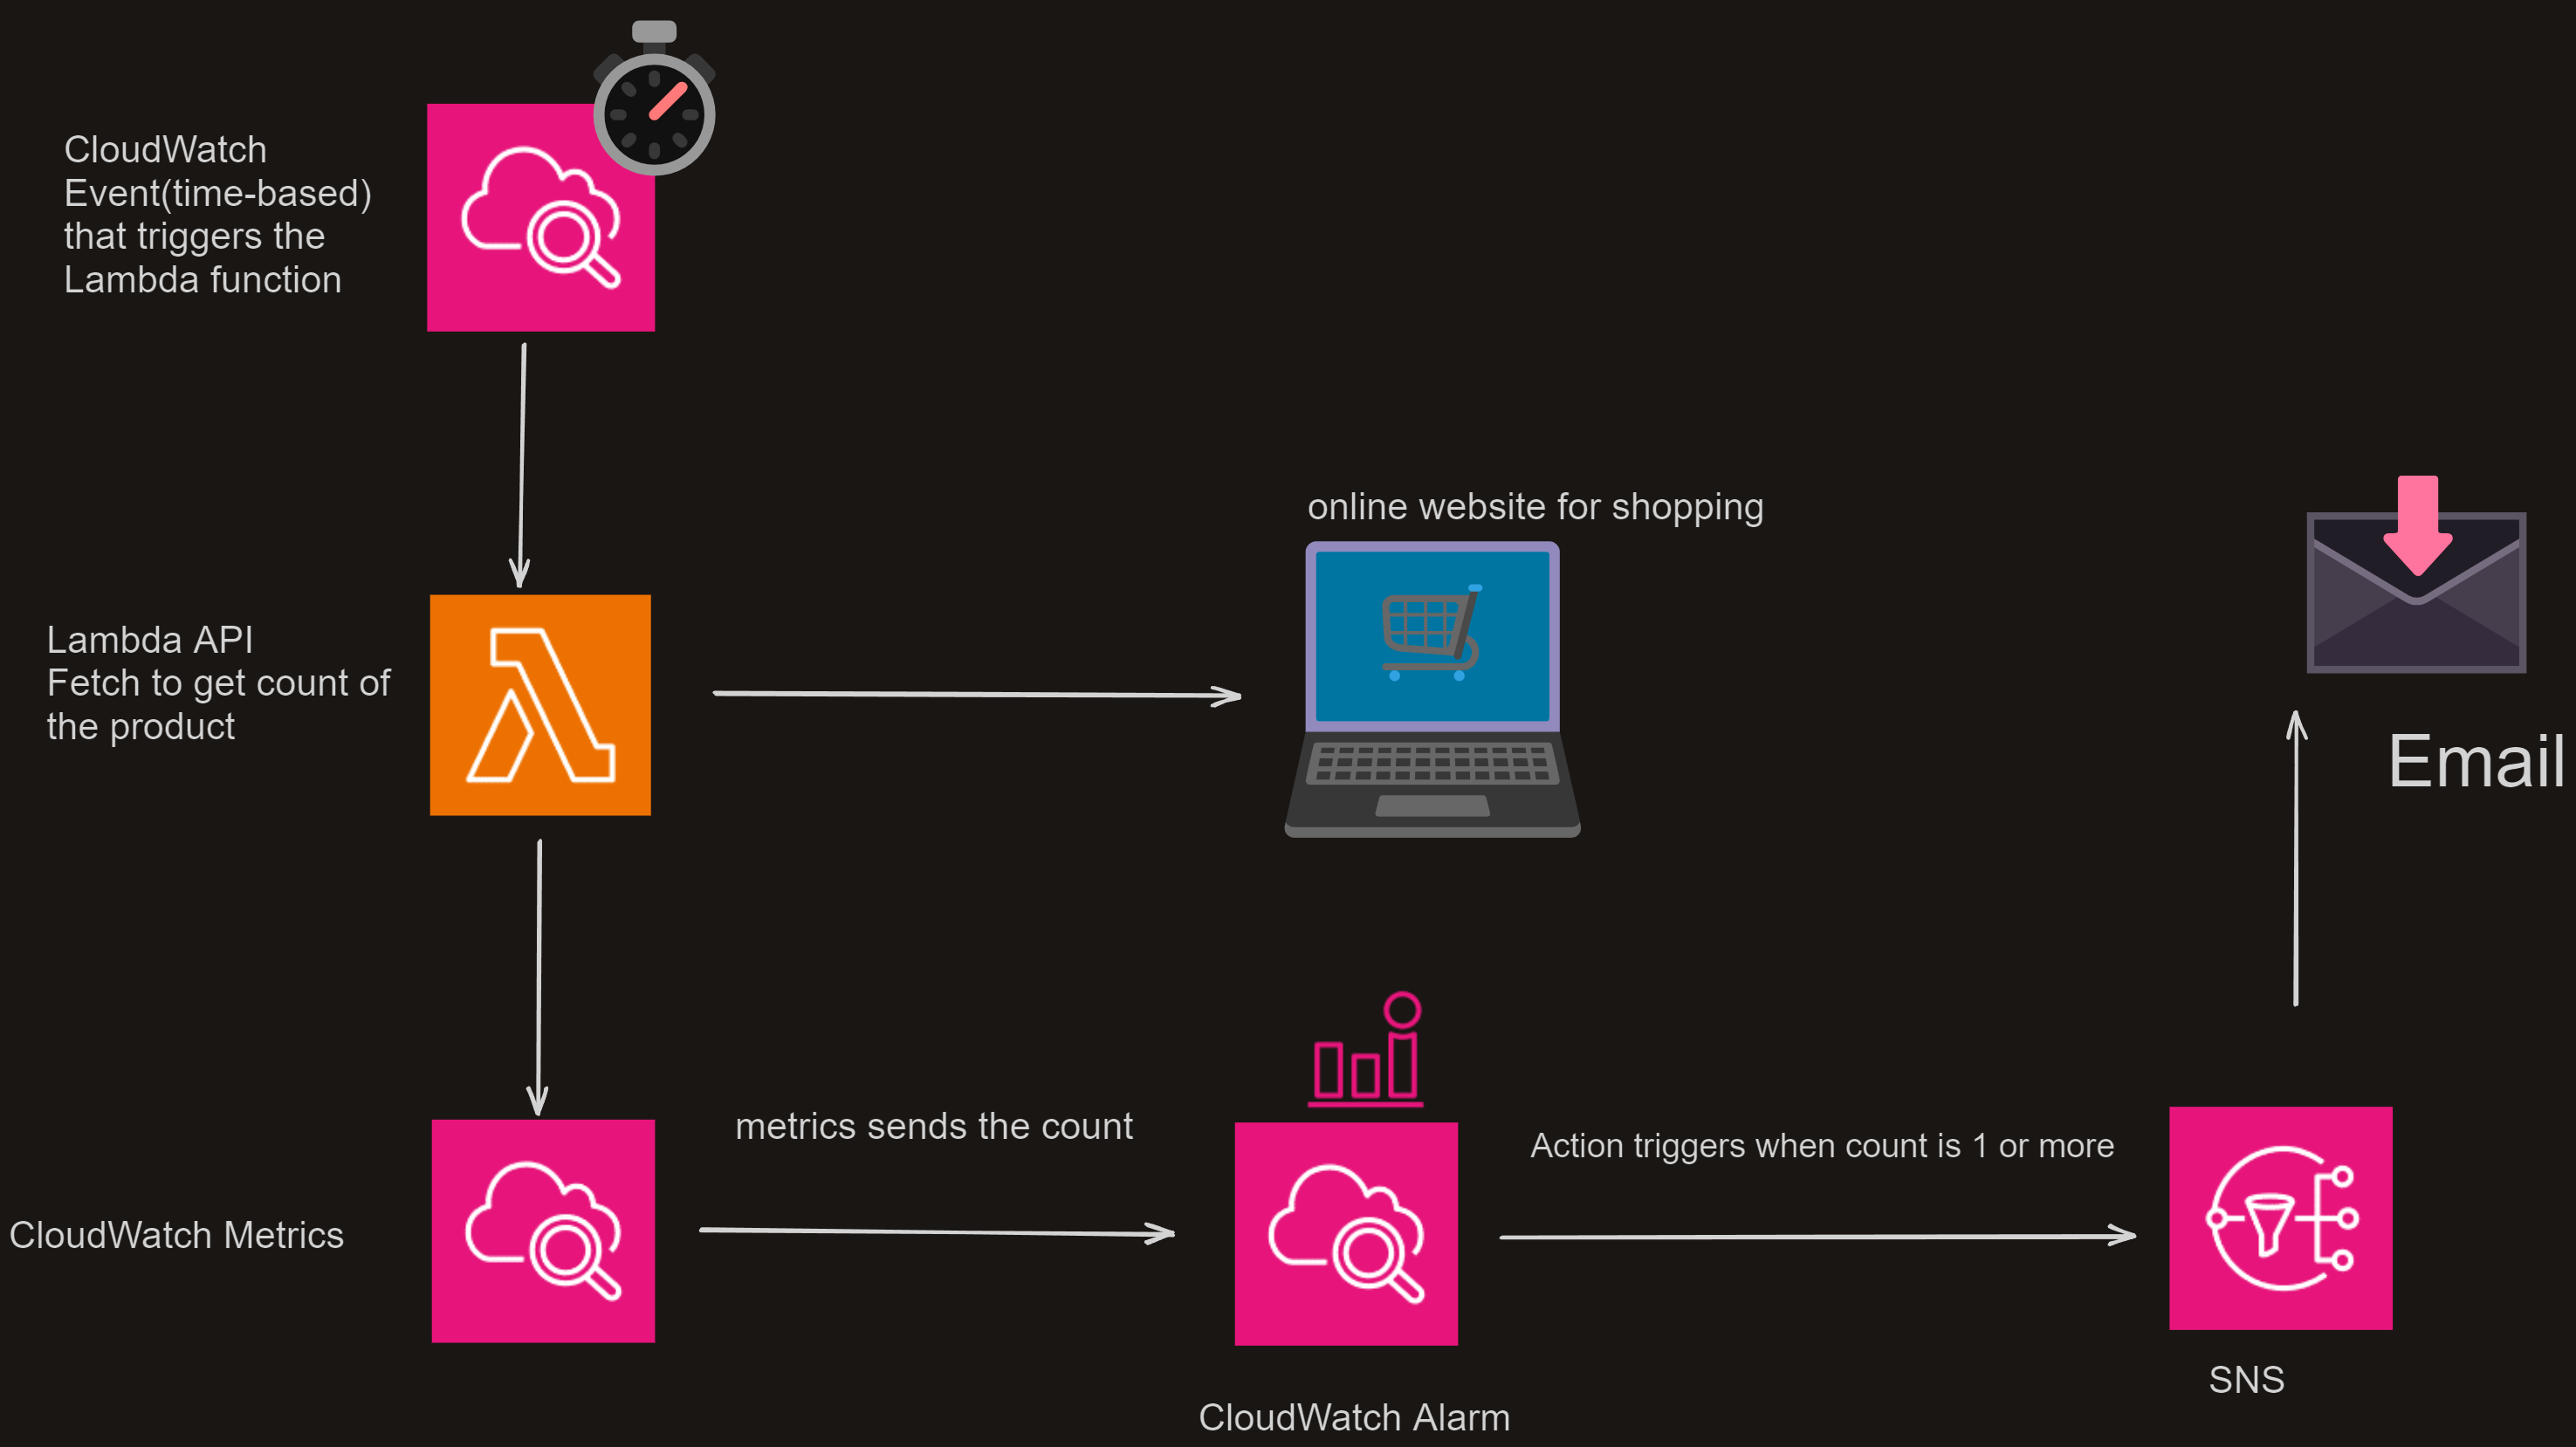
Example: For example, you want a product from some online website but that product is currently out of stock, you want to be notified as soon as the product is back in stock on the website. We can create a lambda function to fetch the count of the product from the website, then accordingly we can set the metrics. We can use the cloud watch alarm and AWS SNS service to get notified over email. But to run this lambda function repeatedly, we can set a CloudWatch event to run the lambda function every 1 minute.
CloudWatch Alarms: As we discussed earlier CloudWatch alarms can notify and help to automatically initiate actions on your behalf. It can keep focus on a single metric over a period of time and help to notify SNS or autoscaling groups.

Auto Scaling with Cloud watch alarms 🔔:
Requirements for this design :
If the CPU Utilization for an instance goes above 80 percent, we need to add another instance using autoscaling groups and the policy. If it reduces to below 40 percent, then we need to scale down the instance.

We have the application configured with a load balancer backed by an EC2 autoscaling group, We want to scale up or down based on CPU utilization. If CPU utilization is above 80% then we want to scale up and if it's below 40% then we want to scale down.
Here the EC2 instances are already configured with CloudWatch agents to receive the information from the instances to CloudWatch, then we have configured the cloud watch alarm to trigger upon the metrics.
Once the metric value reaches 80 percent it triggers the alarm and then it sends the alarm to trigger the autoscaling policy to scale up the autoscaling group. Once the CPU utilization is back to 40% then it triggers the alarm again to scale down.
Conclusion: AWS CloudWatch emerges as an indispensable service within Amazon Web Services, offering a comprehensive suite of tools and features that empower organizations to effectively manage and monitor their cloud-based resources and applications.